 |
Jails for the 80s NYC DOC Report |  |
|
Jails for the 80s NYC DOC Report | |
|
POPULATION INTRODUCTION Current Departmental projections for the period 1981 - 1985 indicate that a moderate increase will occur in the total population as a result of increasing length of stay among adult detainees and continuing growth in the adolescent detainee group. Over the five year period it is estimated that the average daily population of the Department will increase by approximately 300-400 persons. The purpose of this section is to examine the projected population trends of City inmates and how this translates into future required capacity needed by the system in the years 1981-1985. VARIABLES In developing its population projections the Department analyzed both demographic and criminal justice variables. Key demographic factors include employment, size of the crime prone age group and general population shifts. The impact of criminal justice variables including administrative actions by police and courts, diversion, and statutory elements, far outweighs the demographic issues to the point that an inverse relationship exists between unemployment and the size of the City's jail population. An assessment of major public safety legislation enacted in recent years, including Rockefeller drug laws and the Violent Felony Offender statutes demonstrates that a direct correlation exists between legislative activity and jail population. The effects of such criminal justice system variables during the 1981-1985 period are extremely difficult to quantify since new legislation is outside of the control of those who manage the criminal justice system. A series of research projects and studies conducted across the nation during the 1970s points out of the limitations of corrections planners in predicting prison and jail population reliably. In 1970, a New York City Rand Institute study forecast the 1970-1975 City detainees and sentenced population. Their average daily projected detainee population for 1975 was 8,680 with a range of 5,000-15,000. The actual figure in 1975 was 5,310. In 1974, the Congressional Research Service prepared a set of projections based on unemployment data. The projected peak of that study was passed within two years of the release of that report. In 1975, the National Planning Association prepared a manpower needs projection-for the criminal justice system in which it projected a gradual increase in prison population over ten years. Its high point has already been exceeded. A current study, entitled Prison Population and Policy Choices, prepared by Abt Associates under a Congressional mandate, highlights the weaknesses of earlier studies and stresses the need to focus attention on criminal justice variables and the impact of changes in criminal justice policy on inmate population. The basic conclusion from an examination of those factors which include system management trends, legislative activity and general public climate is that a continuing increase in jail population will occur. The degree of precision in the Department's projections beyond 12-15 months is limited. The capital development plan, therefore must remain adaptable to criminal justice factors and be sufficiently flexible to implement necessary adjustments. POPULATION MANAGEMENT In addition to assessing those public and legislative factors which appear to be a principal cause of increasing population, the Department also examined those components and actions within the criminal justice system which tend to hold population down or, in a sense, manage people out of the system. In 1970, New York City's jail population peaked at 13,765. That population included a mix of 6,098 sentenced and 7,667 detainees. In view of an almost overwhelming population problem, the City began an aggressive program of population management to ensure that only those persons absolutely requiring confinement went to jail. Developments were initiated in two major areas: operational improvements and diversion programs, many of which were funded with federal dollars. Police and district attorneys attempted to identify high priority cases and weed out those where successful prosecution was improbable. Innovations such as desk appearance tickets, early case assessment, the establishment of major felony bureaus and the programs and activity of the Pretrial Services Agency (now CJA) which verified community and family ties and submitted release recommendations to the court have all impacted the level of pretrial population. Funding for community based diversion programs as well as pretrial and sentencing alternatives to jail has diminished drastically. The cutback of and eventual dismantling of the Law Enforcement Assistance Administration will further erode capacity of these "pressure-release valve" programs. The Department's adolescent population is most severely impacted by this shift since that group has been the primary target population for most diversion efforts. In summary, unless the management and operational improvements within the criminal justice system continue, actual population will surpass the Department's projections sooner than anticipated. POPULATION AND CAPACITY In order to determine the future required capacity to accommodate projected population it is necessary to take into account several critical factors:
AVERAGE DAILY POPULATION An analysis of the projected average daily (ADP) population reveals the following:
SECURITY LEVEL Within each of the housing categories mandated by law, the Department has created three levels of security: minimum, medium, maximum. In addition to meeting the demands of overall inmate population, the future capacity of the system must be adequate to accommodate each sub-category. An analysis of the needs of these sub-categories reveals that virtually all future construction and renovation must be aimed at providing maximum security cell space. LOCATION An underlying assumption of this plan is that the Department of Correction will remain on Rikers Island and utilize fully the existing facilities located there. As the inmate population swells and the number of usable cells on Rikers Island decreases (as when the Federal District Court Order limiting HDM occupancy to 1200 is implemented), Rikers Island will begin to experience a shortage of high security space for detainees. The number of Manhattan detainees ranges from 1700 - 2000. The Manhattan House of Detention, presently under reconstruction, will provide up to 360 secure general confinement cells in lower Manhattan. Recognizing the desirability of having detainees in a location easily accessible to the courts, friends, family and attorneys, it becomes apparent that providing an additional 500-600 new cells in Manhattan will help to meet this goal. FUTURE CAPACITY REQUIREMENTS In the New York City corrections system, required capacity may be determined by adding a 15% contingency, or swing, factor to the projected average daily population. Departmental experience has shown that 15% represents a reasonable factor to account for anticipated fluctuations from day to day over the average population. The projected design capacity for City inmates alone for the period 1981 to 1985 is as follows: 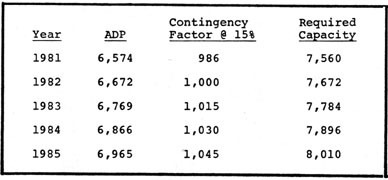 The average daily population projections represent an amalgam of several projection methodologies coupled with a certain amount of judgment based on experience. These figures are based on the assumption that current criminal justice practices will prevail in large measure for the next five years and that no new legislative changes will be made. A hardening of public attitude on crime could easily force more people into the criminal justice system and subsequently into jail. Moreover, an erosion of diversion and alternative programs will also increase the flow of prisoners. The contingency or swing factor also is subject to variation depending on several factors. Historically, 15% has been a reasonable administrative margin. The cumulative effect of deferred maintenance can increase the number of inoperable cells. Changes in prosecution, law enforcement and court procedures could cause more severe fluctuations beyond past boundaries. |
<<< previous page |
Next page >>> |